Visualizing Progress
I am currently thinking a lot about what the next steps of this project are, and what that means for the direction of these posts. The compiler needs a good amount more work, but it’s finally starting to become usable. That means that before too long I need to start fleshing out the VM and hardware specs. In the meantime, there’s a lot of cleanup to do, and even more issues with regard to compiler ease-of-use and practicality. With that being said, I now have some concrete visuals and benchmarks for the compiler in general.
Visualizing the Syntax Tree
Over the past week I’ve been playing with graph visualization tools to try and generate an easily-digestible view of the compiler’s syntax tree. I ultimately ended up settling on a utility called Graphviz. It is an easy to use package which has incredible power and expressivity to generate all sorts of graphs. The key feature is that it can take input from a file in “DOT Language” containing info about nodes and edges, and then do all the heavy lifting to spit out an image file with a nicely organized graph.
In order to generate the graphs, I added a function that just walks the AST and serializes it node-by-node within the compiler. That output encodes information about each node’s type, text, child, and sibling. Then, I parse that file into a Java program that reconstructs the leftmost child/right sibling tree as it was in the compiler. From there, the Java program refactors the tree so that each node can also know a full list of all of its children. After that, all that’s left to do is generate some formatting parameters for nodes and edges, and simply spit them out in DOT format, Graphviz does the rest! Let’s have a look at the results:
Trees for Simple Expressions
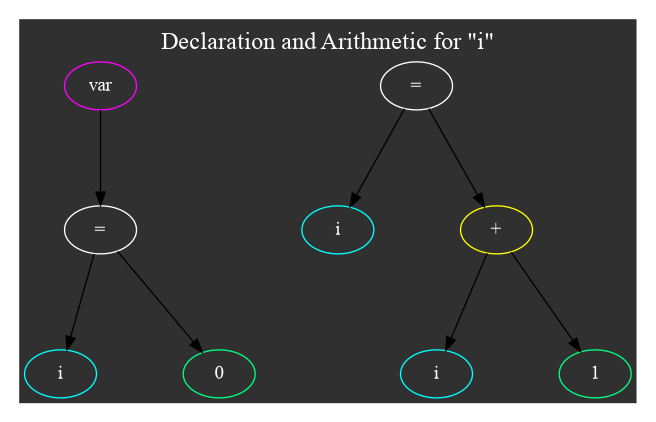
Here’s what the syntax trees look like for the expressions var i = 0; and i = i + 1
Trees for Conditional Logic
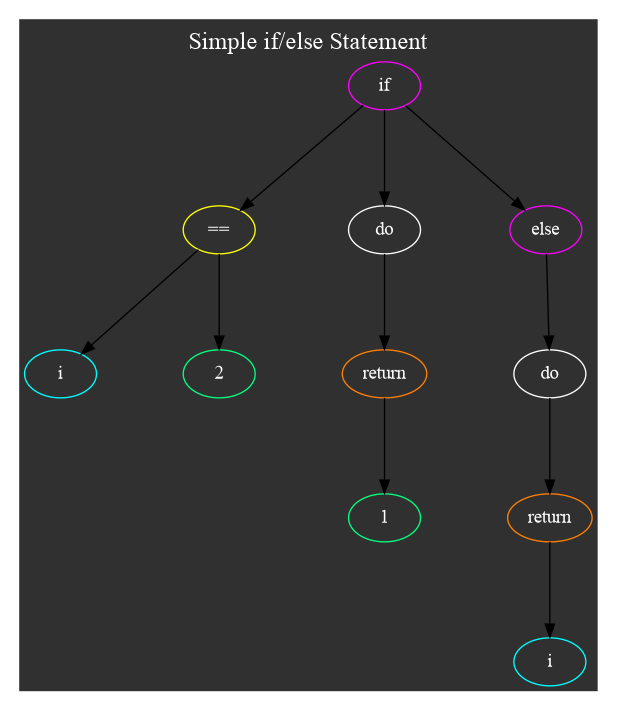
For a simple if/else statement, here’s what things look like:
if(i==2)
    return 1;
else
    return i;
Examining an Entire Function
Now that we’ve seen some simple tree representations of code, let’s step it up a notch. Remember our old friend, firstnfibs()? It took an argument n and calculated the first n fibonacci numbers, placing them into an array at a hardcoded location in memory. Then, it looped over that array to print each number out. Here’s its AST graph - can you figure what each statement’s source code would roughly look like?
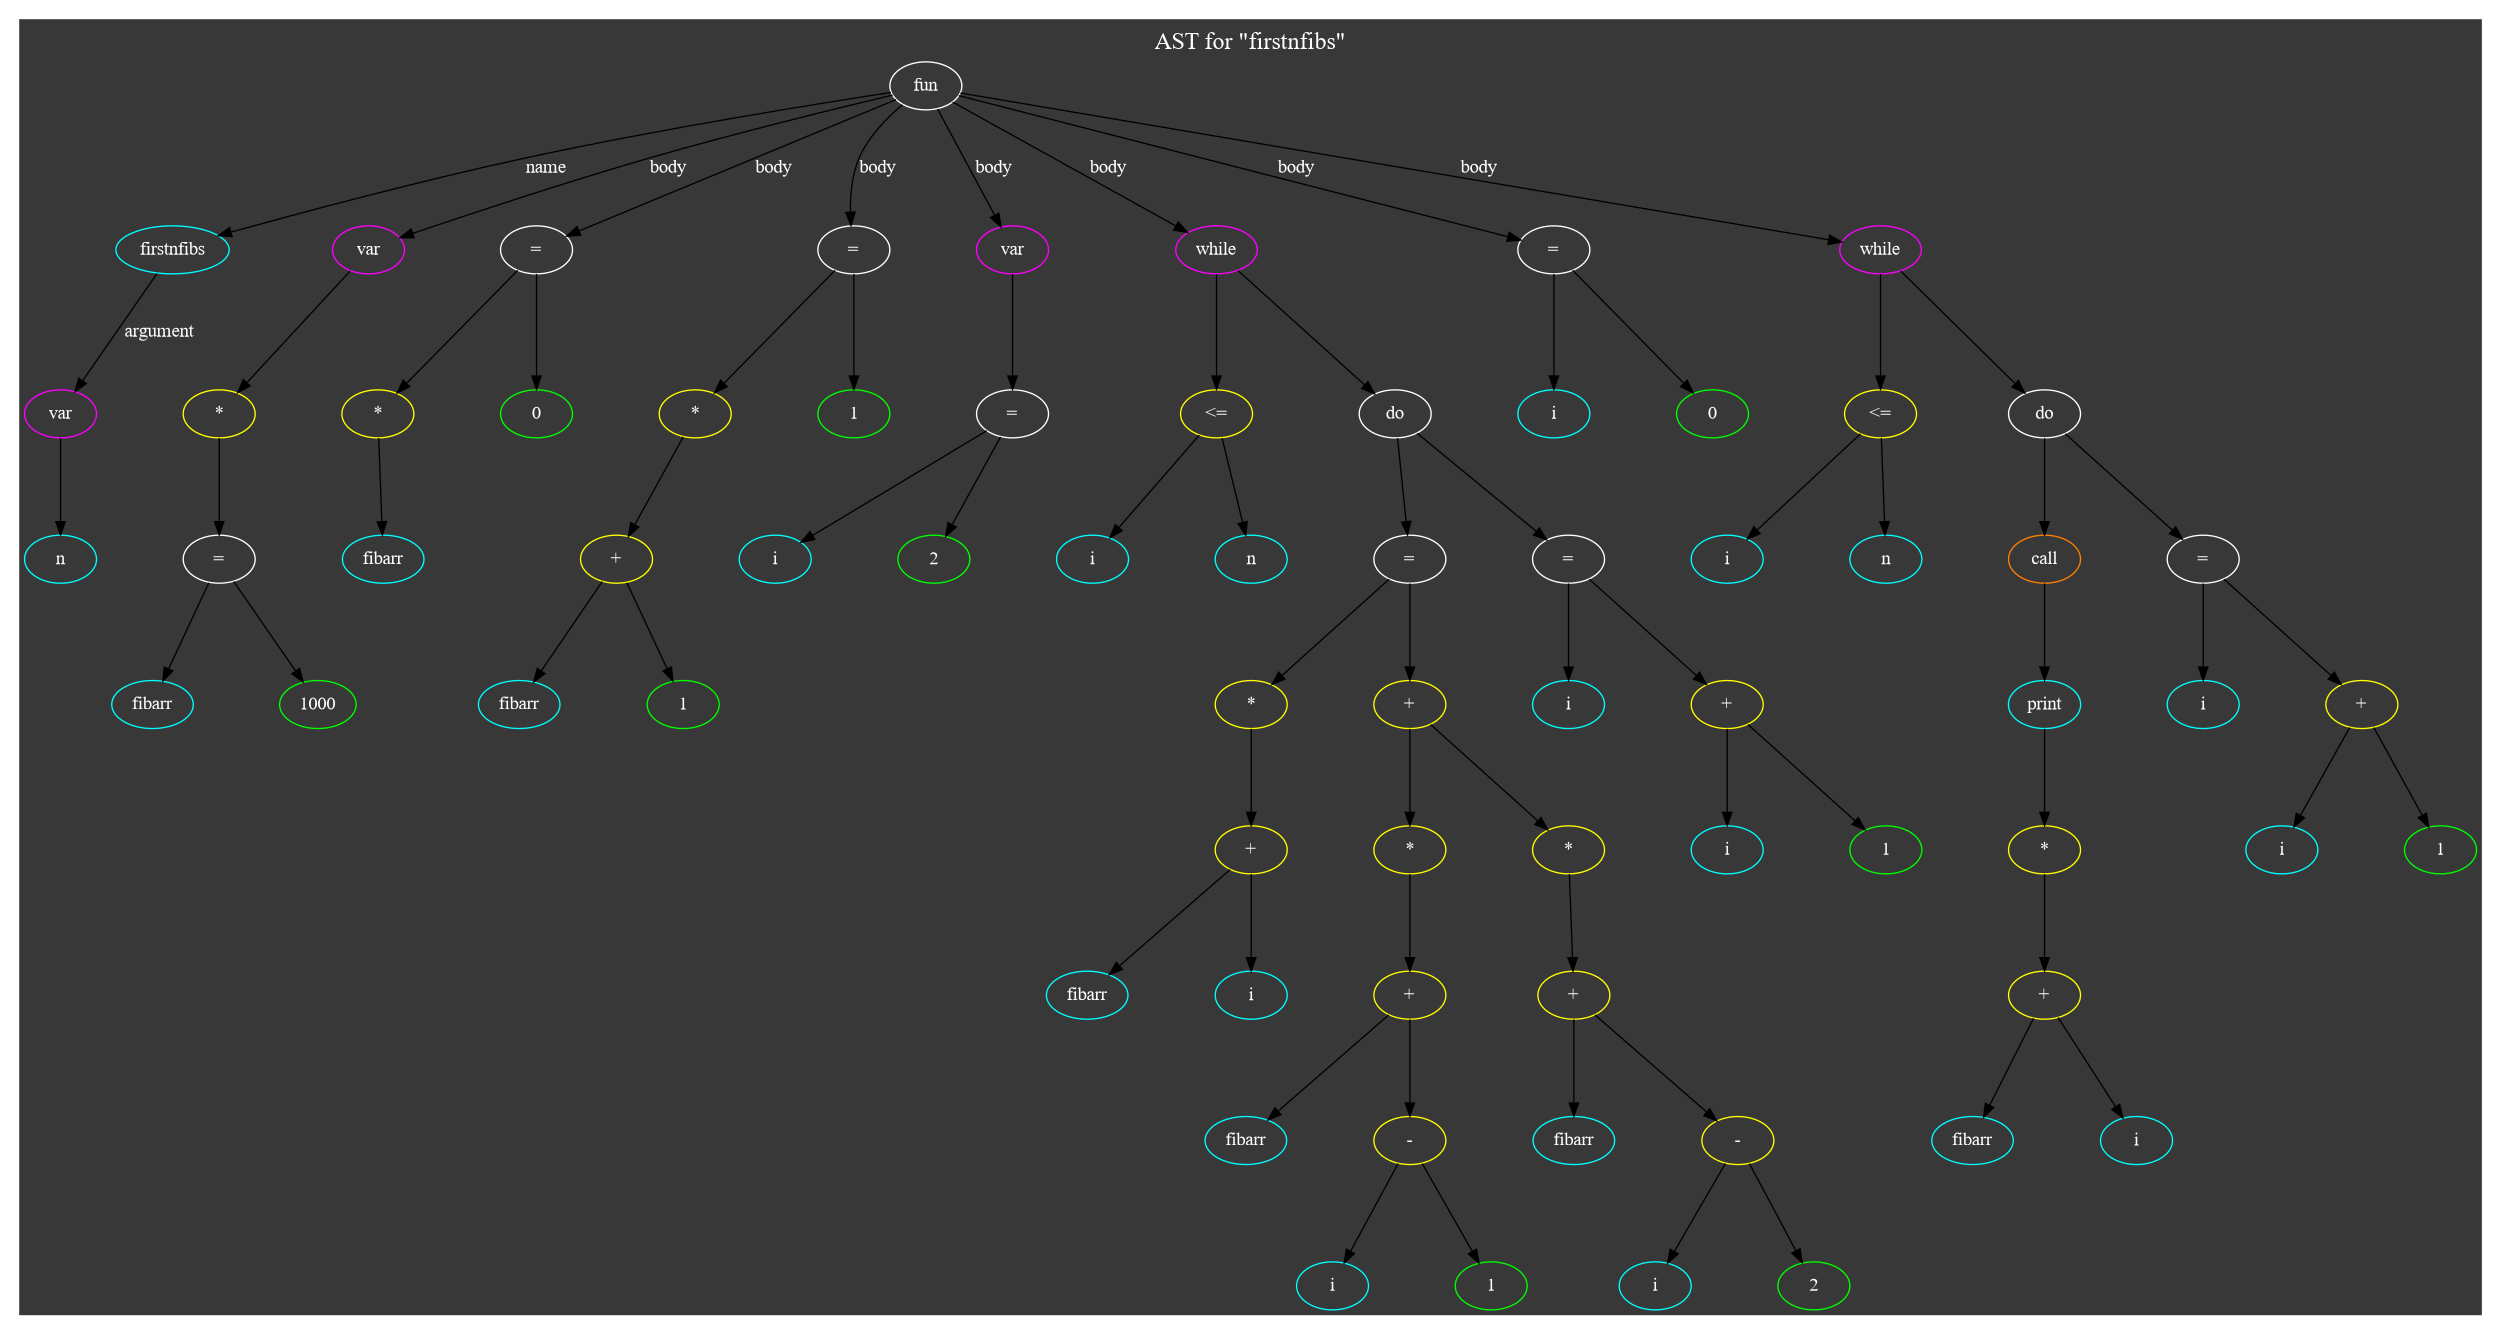
The first child of the “fun” node is the function name, with the function’s argument type and name parameters as its children. All the other children of the function node are individual statements from the function body. The children are ordered exactly as they are parsed, with the earliest statement leftmost. It’s interesting to see how deep the expression trees go, even for a relatively simple function!
Say, What’s the Register Allocator up To?
Now that the register allocator is working properly, it’s possible to see performance differences by increasing or decreasing the number of registers the allocator is allowed to use. This table lists out the number of instructions needed to run the firstnfibs() function with an argument of 20. Naturally, with fewer registers to work with, more instructions are spent moving values back and forth between the stack and registers.
| Registers Enabled During Codegen | 3 | 4 | 5 | 6 |
|---|---|---|---|---|
| Instructions Executed | 1099 | 1056 | 940 | 883 |
Now that my journey out of “just-get-it-working-land” is underway, It’s only a matter of time before I need to expand into some more rigorous performance profiling tools. It’s great to peek inside the compiler and see the AST, and I’d also like to figure out a way to see the basic blocks in the IR as well. I will also need to have access to information about the CPU and what it’s really up to as well, especially as the project moves more into the scope of software. Thanks for reading, and I hope to have a new update with some exciting features soon!